
 The Centers for Disease Control and Prevention has ensured a wave of Tri-Cities evictions is not going to happen – at least not until the first of the year. In one of the biggest “kick the can down the road” moves of the pandemic, CDC threw a short life-line to qualifying renters. But the order left out help for landlords.
It’s unclear how many households in Northeast Tennessee and Southwest Virginia were at risk, but some landlords have tried to move forward with proceedings in local courts. Sullivan County clerks were recently quoted saying they’ve seen eviction filings since the Tennessee Supreme Court allowed the cases to proceed starting June 1. But Circuit Court Clerk Bobby Russell was unable to provide a specific breakdown of cases because evictions are categorized as contract debts, which are mixed in with credit card debt, hospital debts, and other types of cases.
According to Polly Peterson, a local legal aid attorney, “We haven’t seen all that big a surge in landlord-tenant cases in Sullivan County.” She is the associate director of litigation of Legal Aid of East Tennessee.
The CDC order now in place comes on the heels of some hefty 2020 fair market rent increases, a labor market reeling from job losses, and generous unemployment assistance that initially kept the economy going, but that has now petered out and is the center of political wrangling. In other words, it’s what’s becoming knows a typical 2020 situation.
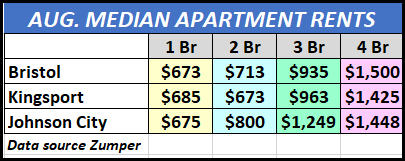
Here’s a brief update on how local renters and how much they are paying.
HOW BIG IS THE RENTAL MARKET?
 It’s big and given the current housing market’s low inventory of homes for sales and increasing prices, it’s expected to be bigger next year.
The best public count comes from the Census Bureau’s American Community Survey (ACS). The most current version is for 2018. The first 2019 releases will be available in a month or so.
According to the 2018 estimate, there were 63,523 renter-occupied housing units in the Tri-Cities. The biggest share of total occupied housing units is in the three-county Johnson City MSA 35.2% of that MSA’s total occupied housing units. The four-county Kingsport-Bristol share was 26.6%. The plus/minus on the estimate was 6,000 units, and considering the multi-family construction in 2019, it’s safe to say the current number of rents is north of 70,000.
VACANCY RATES – APARTMENT COMPLEXES
While a current public count of the number of large apartment complexes and their vacancy rates is not readily available, the Johnson City historically has one of the lowest vacancy rates in Tennessee. Rates in Kingsport-Bristol have been a little less but likely improved with the addition of several large complexes.
The apartment sector trade press is reporting that Class C apartment complexes are taking the biggest hit. At the same time, the Class A complexes are reportedly seeing no or little rent issues. So far, it doesn’t appear that there has been much of a local movement to reduce rents. However, there has been an increase of complexes offering rent relief in the form of move-in and other incentives to keep their occupancy rates up.
VACANCY RATES – SINGLE-FAMILY AND CONDOS
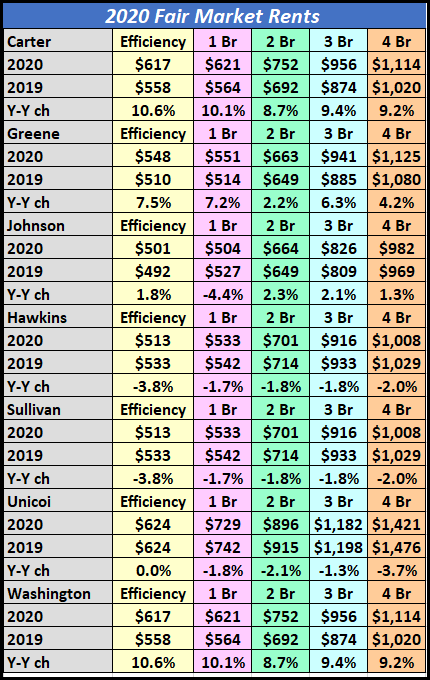
Fair Market Rents are set by the U.S. Dept. of Housing and Urban Development. While they do not necessarily represent current market rates they are a benchmark for local rental market conditions and for housing assistance.
Attom Data Solution’s Q3 Vacant Property and Zombie Foreclosure Report shows 49,318 non-owner occupied investment properties in the Tri-Cities. That count is for single-family homes, townhome, and condo rentals.
The vacancy rate was highest in Sullivan Co. – 5.6% – while it was 4.1% in Washington Co. The Tennessee vacancy rate was 3.1%, and the U.S. rate was 4.02%.
A drill-down on local vacancy rates by zip code found the highest area rate in Sullivan Co.’s 37665 – 13.7%- and the lowest in Piney Flat’s 37686 – 1.8%.
RENT COLLECTIONS
The mass media is reporting many tenants have been unable to pay rent, and nonpayment evictions have been limited by state moratoriums and the coronavirus relief bill. At the same time, the NMHC Rent Payment Tracker reported in August that 92.1% of apartment households paid their rent.
According to the American Housing Survey, a little less than half of U.S. rental properties are owned by mom and pop landlords, while business entities own the rest. Locally the mom and pop share is high in the single-family and townhome rental sector. Local investors also own some of the smaller multi-family complexes.
While the current rules and assistance is focused on renters, landlords and their trade association have been scrambling for equal treatment. They argue that if landlords are not able to pay their mortgages and other costs, it could result in a loss of affordable housing across the nation.
RENTER – LANDLORD CONFIDENCE DATA
The Census Bureau’s most current Household Pulse Survey of 1,281,315 Tennesseans 18 and older in renter-occupied units offers a little context into the rent payment dynamic. Here’s the number responding about their confidence to pay next month’s rent.
No confidence – 219,207
Slight confidence – 268,598
Moderate confidence – 340,445
High confidence – 332,455
Payment will be deferred – 145,544
Did not respond -11,649.
When the same question was put to the state, 3,327,690 landlords, here’s the response about their confidence about their ability to pay next month’s mortgage.
No confidence – 179,208
Slight confidence – 175,200
Moderate confidence – 554,386
High confidence – 1,119,690
Payment will be deferred – 9,615
Did not respond – 4,793
Landlords whose property is free and clear – 1,284,798
© 2020 All Rights Reserved. Donfenley.com. This material may not be published, broadcast, rewritten, or redistributed.
Categories: REAL ESTATE
Thanks for the comment Debbie. It's a snapshot of today's conditions, stay tuned
Always of interest to get confirmation of what I see as the year moves on.
[…] The Tri-Cities employment is in its best shape since the year began, but the gains are concentrated. At the…
Thanks for the question Jeff. Kingsport was not listed because there were no closing of $1 million plus properties during…
Great report Don Why was kingsport not listed ? Jeff Begley Founder & Principal Begley Development LLC